> For the complete documentation index, see [llms.txt](https://docs.racemap.com/llms.txt). Markdown versions of documentation pages are available by appending `.md` to page URLs; this page is available as [Markdown](https://docs.racemap.com/gps-devices/debugging.md).

# Debug tracking devices

Analyzing data sent through the mobile network and debug GPS hardware.

## Data from RACEMAP platform

### Connection Chart

When a GPS tracker drops out mid-race, location data arrives late, or a battery dies unexpectedly, the Connection Chart is the first place to investigate. It visualises your GPS device's connectivity and communication over time — giving you a timeline of exactly what happened and when.

<figure><img src="https://1672210197-files.gitbook.io/~/files/v0/b/gitbook-x-prod.appspot.com/o/spaces%2F-LSRNxaH2Ju9Flr7JhJD%2Fuploads%2FxAcUdkqYlovpqHK0rFzQ%2FConnection%20Chart.png?alt=media&amp;token=c5a3dad3-551a-4233-909f-a4d6181f0925" alt=""><figcaption><p>Green to brown: delay of received coordinates, blue: battery and network insights over the time line</p></figcaption></figure>

<figure><img src="https://1672210197-files.gitbook.io/~/files/v0/b/gitbook-x-prod.appspot.com/o/spaces%2F-LSRNxaH2Ju9Flr7JhJD%2Fuploads%2FExn6WyNAZqt5yzbua1ag%2Fimage.png?alt=media&amp;token=a0f0a10c-d07c-4b5e-ab37-7be66e9dda15" alt=""><figcaption><p>The network layer shows carrier name, used technology 2G or 3G and the country, if we know the information.</p></figcaption></figure>

The Connection Chart shows:

* **Location data delay:** The y-axis displays how many seconds elapsed between a coordinate being recorded by a device (and possibly stored on memory) and received by RACEMAP.
* **Battery history:** A second y-axis tracks battery level over time, helping you to identify power drain patterns and optimise power consumption.
* **Device events:** Toggle specific events to keep the chart readable: open socket, close socket, heartbeat, device info, movement, no movement, and power off.
* **Reload and auto refresh:** Press the reload button to refetch the window, or pick an interval (30 s, 1 m, 5 m, 15 m) to keep it up to date while you wait for a device to report. The label next to it says how old the shown data is. Polling pauses while the browser tab is hidden and resumes when you come back. A reload replaces only the data — your zoom, the statistics panel and the selected series stay as they are.
* **Network layer:** Hover over any block to see the radio type (GSM, 3G, LTE or 5G), Cell ID, Mobile Country Code (MCC), Mobile Network Code (MNC), Location Area Code (LAC), and when the tracker entered and left that cell including the duration. Alternating brown and green blocks indicate a carrier change; while each block represents one network cell. A block with a square edge at the chart border continues beyond the visible window — zoom out or widen the timeframe to see all of it.\
  The connection chart visualises carriers in three ways: (1) solid, full-colour for cells that were measured, (2) lighter blocks with a dashed border where our M2M SIM card was connected but reported no cell, and (3) where nothing is known, the layer stays empty. Carriers are drawn only where there is evidence for reception.\
  Carrier and country come from the MCC/MNC pair, so they are named even for a cell our cell database does not know. Such a block has no position on the map, but it still says which network the tracker was on.\
  The network layer is available for trackers running with our [M2M SIM cards](https://go.racemap.com/gps-tracker#sim-subscription). For other trackers the Network button is locked.
* **Messages:** Switch on the Messages button to see the commands sent to the device, one bar per command. A bar starts when the command was sent and ends when the device answered, so its length is the round-trip time. A solid line runs from the last attempt to the answer. A dotted line with a tick per retry covers earlier attempts that went unanswered. A dashed line means the command is still waiting, up to its deadline. A ✕ marks an error, a hollow dot a command that was never sent.\
  For SMS the bar ends at the network's delivery receipt: a delivered SMS is not an answer from the device.\
  Hover a bar for the command, its state at that moment and the round-trip time. Click it to pin the details: the raw payload with a copy button and the full timeline. Overlapping commands stack in up to three rows; `+n` counts the ones hidden in the last row.
* **Time range:** Pick a quick range such as *Last 6 hours*, type an absolute range, or choose days in the calendar. The arrows next to the range move the window back or forward by its own length, so you can walk through a race hour by hour; the magnifier doubles the window. A quick range stays relative: with auto refresh on, the window keeps following a live device. Your last five absolute ranges are listed under *Recently used ranges*.
* **Copy and paste a time range:** Use the copy and paste buttons in the time range panel to carry a window into another browser tab, e.g. to compare two devices over the same period. The format is the one Grafana uses, so ranges copied from a Grafana dashboard paste here too, and the other way round.
* **Time zone:** All times in the chart — axis, crosshair and tooltips — follow the zone chosen in the time range panel: UTC (the default, as in tracker logs), your browser's time, or the tracker's location.

Access the chart directly from tracker management, or use the URL syntax to open a specific device and time window. Without a time window, the chart shows the last 24 hours: following the tracker live while it is online, or up to its last disconnect once it is offline.

<figure><img src="https://1672210197-files.gitbook.io/~/files/v0/b/gitbook-x-prod.appspot.com/o/spaces%2F-LSRNxaH2Ju9Flr7JhJD%2Fuploads%2FqzwuiUOHjwRvJZKp7G0n%2Fconnection-chart-tracker-management.png?alt=media&amp;token=3f7b46d7-2d60-4d17-a1ba-9f0c9f2aa7a1" alt=""><figcaption><p>Access the Connection Chart for a specific device directly in the tracker management, CONnection column</p></figcaption></figure>

{% hint style="success" %}
**syntax** `https://racemap.com/admin/connection-chart/<appId>?from=2023-11-14T12:30:00.000Z&to=2023-11-14T16:30:00.000Z&timezone=utc&refresh=1m`

relative: `?from=now-6h&to=now` shows the last 6 hours and moves with auto refresh. `timezone` is `utc`, `browser` or a zone name such as `Europe/Berlin`. `messages=true` switches the message lane on.

sample: <https://racemap.com/admin/connection-chart/860201065660881?events=ONLINE&from=2026-08-08T07%3A00%3A00.000Z&to=2026-08-11T16%3A00%3A00.000Z&network=1>

Older links with `startDate` and `endDate` still open the same window.
{% endhint %}

### Tracks API

Pull the timestamps when a specific device recorded a location and when Racemap server received the same location, eg. to check the delay in sending live data through the mobile network.

{% hint style="success" %}
**syntax** `https://racemap.com/api/tracks/trackId/points?startTime=startTime&endTime=endTime`

**sample** <https://racemap.com/api/tracks/59e75469c8adf3c73d75fc66/points?startTime=2018-05-05T10:00:00Z&endTime=2018-05-05T10:15:00Z>
{% endhint %}

* `startTime` and `endTime` timestamps in UTC of the first and the last location in the query
* `trackId` unique Racemap ID of all locations of a specific device

![copy  trackId of the device you want to investigate in participants API](https://1672210197-files.gitbook.io/~/files/v0/b/gitbook-x-prod.appspot.com/o/spaces%2F-LSRNxaH2Ju9Flr7JhJD%2Fuploads%2FCuWuMUrJRRL96hpuNo2f%2Fparticipants-API.png?alt=media\&token=69d6d26d-c49f-46fc-b682-fa18c2be30d0)

{% content-ref url="/pages/-M\_zgpFYgo28IJBo4zVF" %}
[\*/starters, athlete data](/api/participants.md)
{% endcontent-ref %}

| parameter    | description                                                                                                                  | type   |
| ------------ | ---------------------------------------------------------------------------------------------------------------------------- | ------ |
| `lng`        | longitude of location                                                                                                        | string |
| `lat`        | latitude                                                                                                                     | string |
| `elv`        | elevation                                                                                                                    | string |
| `time`       | timestamp in UTC when device recorded the location, in case of interpolation between last two points => linear interpolated  | string |
| `receivedAt` | timestamp in UTC when Racemap recorded the location, in case of interpolation between last two points => linear interpolated | string |

```json
[
{
"lng": 13.818634,
"lat": 51.107761,
"time": "2018-05-05T10:00:09Z",
"elv": 261,
"receivedAt": "2018-05-05T10:00:23.644Z"
},
{
"lng": 13.817738,
"lat": 51.107412,
"time": "2018-05-05T10:00:24Z",
"elv": 276,
"receivedAt": "2018-05-05T10:00:37.785Z"
},
{
"lng": 13.817476,
"lat": 51.107295,
"time": "2018-05-05T10:00:39Z",
"elv": 273,
"receivedAt": "2018-05-05T10:00:52.769Z"
},
{
"lng": 13.817476,
"lat": 51.107295,
"time": "2018-05-05T10:00:53Z",
"elv": 273,
"receivedAt": "2018-05-05T10:01:09.064Z"
},
{
"lng": 13.816854,
"lat": 51.106363,
"time": "2018-05-05T10:01:08Z",
"elv": 245,
"receivedAt": "2018-05-05T10:01:22.696Z"
},
{
"lng": 13.816932,
"lat": 51.105763,
"time": "2018-05-05T10:01:23Z",
"elv": 235,
"receivedAt": "2018-05-05T10:01:37.651Z"
},
{
"lng": 13.816588,
"lat": 51.105129,
"time": "2018-05-05T10:01:38Z",
"elv": 220,
"receivedAt": "2018-05-05T10:04:40.289Z"
}
]
```

## Record logs of tracking hardware

### Queclink GL320

#### Requirements

* Tracking device is turned on.
* UART data cable
* Windows computer
* We use the CoolTerm software to record the logs of the tracking device. Download CoolTerm here <https://coolterm.en.lo4d.com/windows>
* Enable the USB port of the computer for UART communication.\
  [Read documentation.](/gps-devices/config/cable.md#requirements)

{% hint style="info" %}
The device needs to be connected to the computer to record logs. You have to take the computer with you when reproducing specific tracking scenarios.
{% endhint %}

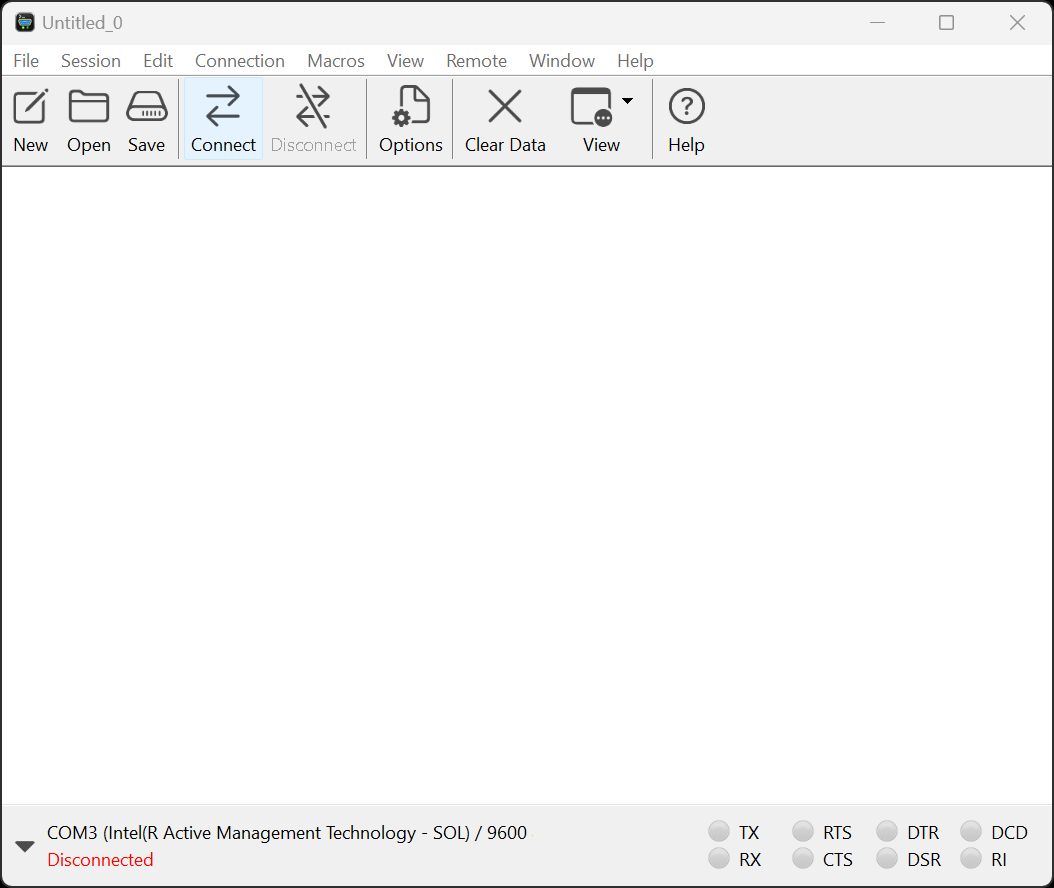
On Clicking on CoolTerm icon. The first window you see is this

<figure><img src="https://1672210197-files.gitbook.io/~/files/v0/b/gitbook-x-prod.appspot.com/o/spaces%2F-LSRNxaH2Ju9Flr7JhJD%2Fuploads%2Fgit-blob-b4056c868db94c459bdbd5b487a552b23a17f3e0%2F1.png?alt=media" alt=""><figcaption></figcaption></figure>

When connecting a powered-on device to the COM port via the UART cable, CoolTerm won't display it automatically. Users must configure CoolTerm each time it's opened, making sure the device is powered on and connected before initiating the application.

**Settings in CoolTerm**

Options >> Serial Port:

* UART: Select the port which is enabled for UART communication.
* Baudrate: 115200

<figure><img src="https://1672210197-files.gitbook.io/~/files/v0/b/gitbook-x-prod.appspot.com/o/spaces%2F-LSRNxaH2Ju9Flr7JhJD%2Fuploads%2Fgit-blob-9f12cf83dbf8e31b04e1acfa0872f60551940203%2F2%20(1).png?alt=media" alt=""><figcaption></figcaption></figure>

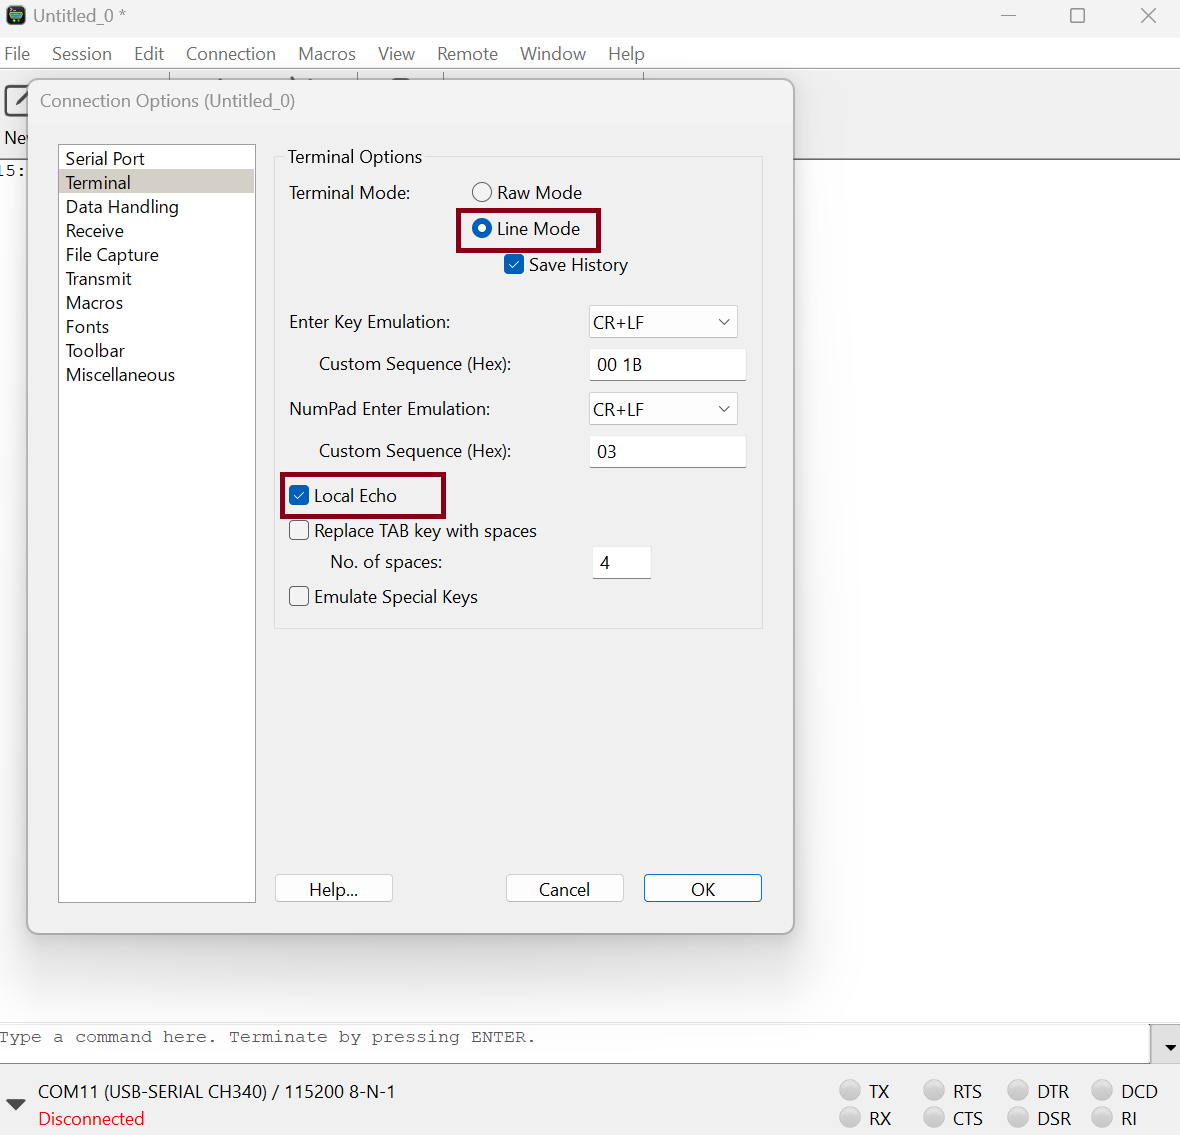
Terminal:

* Line Mode
* Local Echo

<figure><img src="https://1672210197-files.gitbook.io/~/files/v0/b/gitbook-x-prod.appspot.com/o/spaces%2F-LSRNxaH2Ju9Flr7JhJD%2Fuploads%2Fgit-blob-3426403b3b56284b889704e76efa6b56fc0005b6%2F3.png?alt=media" alt=""><figcaption></figcaption></figure>

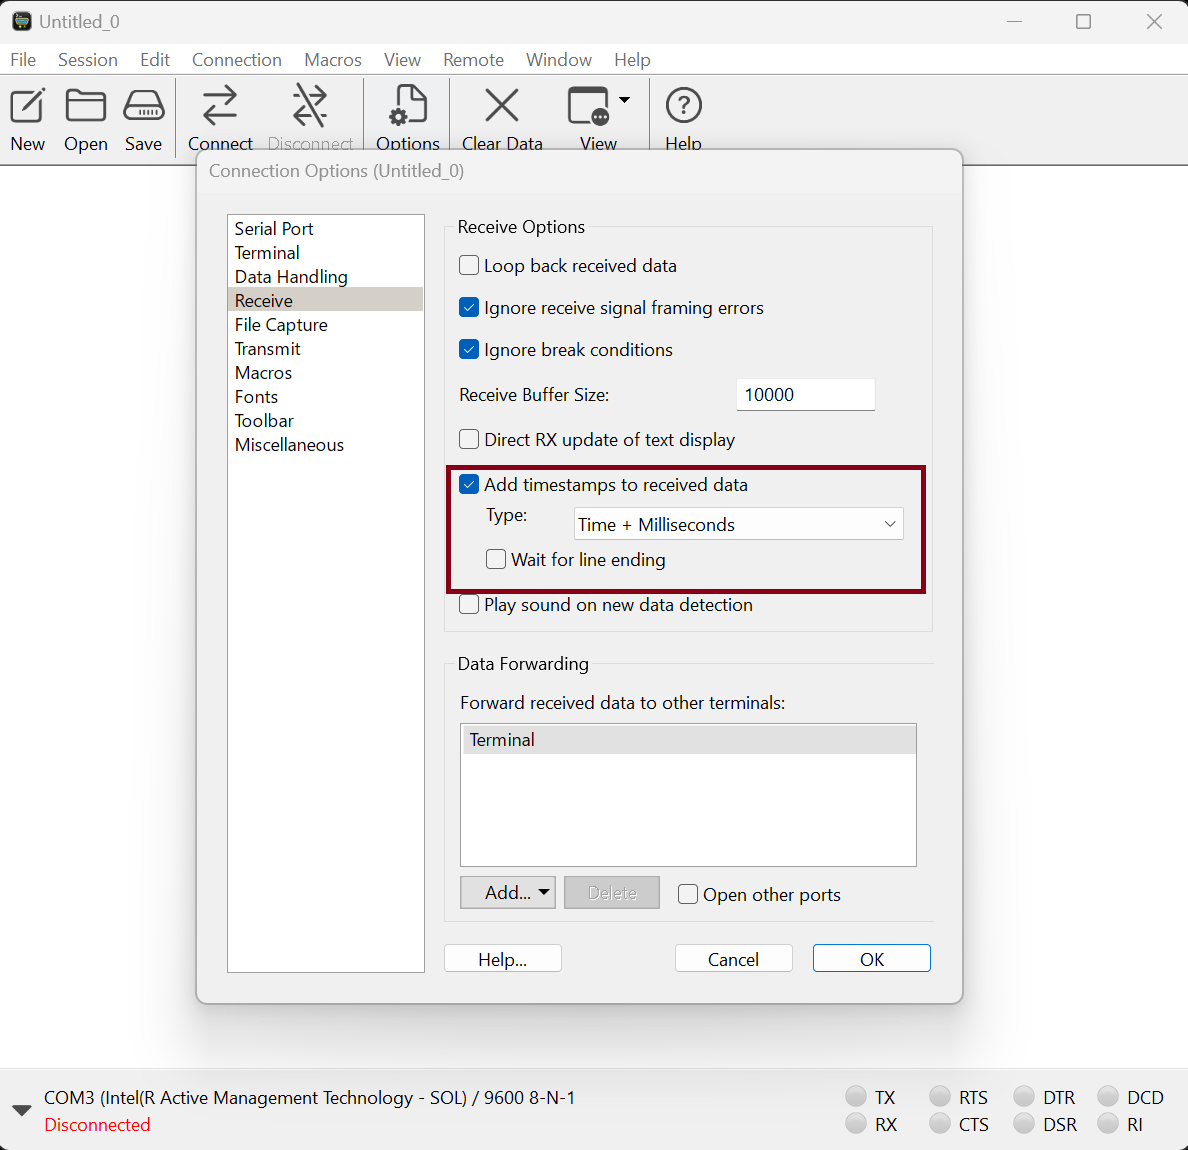
Receive

* Add timestamps to received data

<figure><img src="https://1672210197-files.gitbook.io/~/files/v0/b/gitbook-x-prod.appspot.com/o/spaces%2F-LSRNxaH2Ju9Flr7JhJD%2Fuploads%2Fgit-blob-f5fcdfcecf578bf5f2782b0c17bdd88c999587c7%2F4.1.png?alt=media" alt=""><figcaption></figcaption></figure>

File Capture:

* Select the file in which you want to capture the logs.

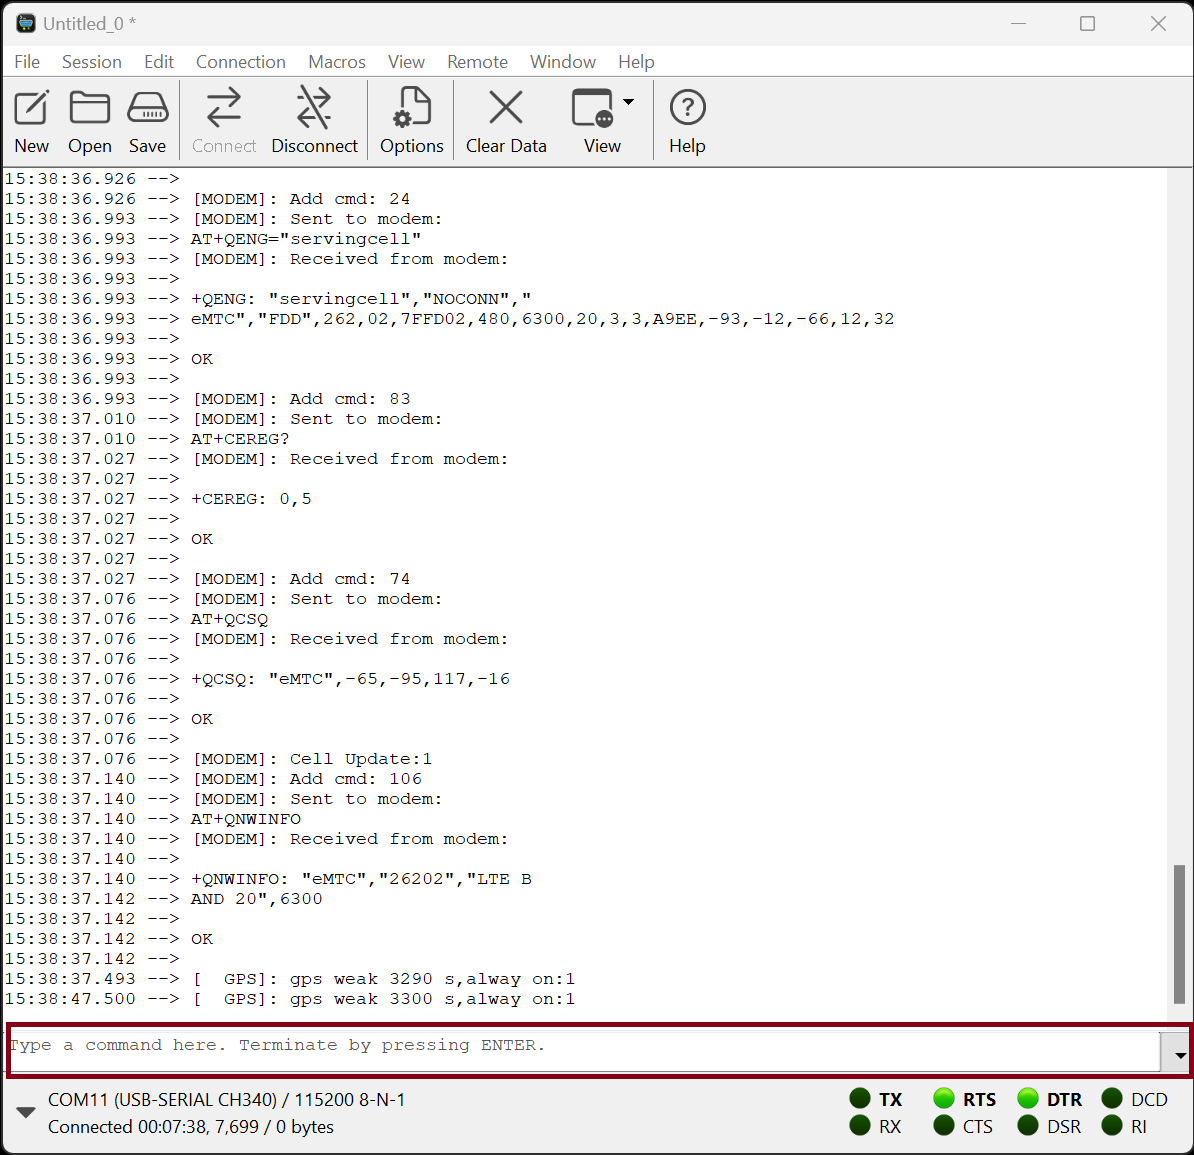
**Commands:**

Send the command to the device to send logs using the command field:\
`AT+UARTLOG=9`

Send the command to the device to stop sending battery-related logs:\
`AT+UARTLOG=0,BAT`

Send the command to the device to stop sending logs:\
`AT+UARTLOG=0`

<figure><img src="https://1672210197-files.gitbook.io/~/files/v0/b/gitbook-x-prod.appspot.com/o/spaces%2F-LSRNxaH2Ju9Flr7JhJD%2Fuploads%2Fgit-blob-9f5928b54d6c86cacb4ecfd8fc903c6bf37de19f%2FScreenshot%202024-02-09%20153904.png?alt=media" alt=""><figcaption></figcaption></figure>


---

# Agent Instructions
This documentation is published with GitBook. GitBook is the documentation platform designed so that both humans and AI agents can read, navigate, and reason over technical content effectively. Learn more at gitbook.com.

## Querying This Documentation
If you need additional information that is not directly available in this page, you can query the documentation by asking a question.

Perform an HTTP GET request on the following URL with the `ask` and `goal` query parameters:

```
GET https://docs.racemap.com/gps-devices/debugging.md?ask=<question>&goal=<user_goal>
```

`ask` is the immediate question: it should be specific, self-contained, and written in natural language.
`goal` is what the user is ultimately trying to achieve, the reason they need the answer. Sharing it helps GitBook give you a better, more relevant answer. A goal is most helpful when it describes the outcome the user wants rather than restating the question. For example, with `ask=how do I create an API token`, a goal like `automate deployments from our CI pipeline` lets GitBook tailor the answer to that use case.

The response will contain a direct answer to the question and relevant excerpts and sources from the documentation.

Use this mechanism when the answer is not explicitly present in the current page, you need clarification or additional context, or you want to retrieve related documentation sections.